Can you predict the next candle? Why most traders are close to 50%
How to measure whether your chart reading beats a coin flip, why 30 good calls prove nothing, and how calibration shows whether your confidence is honest.
Ask a room of traders whether they can predict the direction of the next few candles better than chance and most hands go up. Ask them for proof and the room gets quiet. We remember the calls that worked, forget the ones that didn't, and judge ourselves on a handful of memorable trades.
This article is about measuring your edge honestly. That sounds like statistics, and it is, but the ideas are simple and they will change how you look at every trading claim you read.
The baseline is a coin flip
If you guess "up" or "down" at random, you will be right about half the time. That is the baseline. Any method, indicator or gut feeling has to beat it to be worth anything.
In crypto there is a twist: over long periods prices drifted up, so "always guess up" scores a bit above 50% on many datasets. A fair test compares you with that drift, not just with a perfect 50%.
Why a few good calls prove nothing
Suppose you make 20 predictions and get 13 right: 65%. Impressive? Let us check how often pure luck produces that.
If every call is a coin flip, the chance of getting 13 or more right out of 20 is about 13%. Roughly one in eight people guessing randomly would score as well as you. You cannot tell skill from luck yet.
Sample size changes everything:
| Calls | Correct calls needed before luck becomes an unlikely explanation (under 5%) |
|---|---|
| 20 | 15 (75%) |
| 50 | 32 (64%) |
| 100 | 59 (59%) |
| 400 | 217 (54%) |
The table is the reason Candle Academy shows a 95% confidence interval around your accuracy instead of just a percentage. If the interval still contains 50%, the honest conclusion is "we don't know yet".
What to expect from yourself
Here is a useful reality check. With no edge at all, pure guessing over 50 calls lands anywhere between about 36% and 64% in 95 out of 100 cases. Over 100 calls, between about 40% and 60%. So a score of 58% after 50 rounds feels like talent, but it is well inside what a coin produces.
If your first few dozen rounds end up near 50%, that is not a failure. It is the most valuable lesson in trading, and it is cheaper to learn in a game than with your savings.
Habits that tend to help:
- Follow the higher timeframe trend instead of predicting reversals.
- Use low confidence on unclear charts instead of forcing a strong opinion.
- Be stricter in choppy markets. Clean trends are easier to read than sideways noise.
Confidence matters: calibration
Being right is only half the story. The other half is knowing how sure you should be.
A forecaster is well calibrated when things they call "70% likely" happen about 70% of the time. Weather forecasters are famously well calibrated. Most traders are not: their "I'm 90% sure" calls come true maybe 55% of the time.
That matters because confidence drives position size. If you are overconfident, you bet big on calls that are barely better than a coin flip, and a few losses wipe out many small wins.
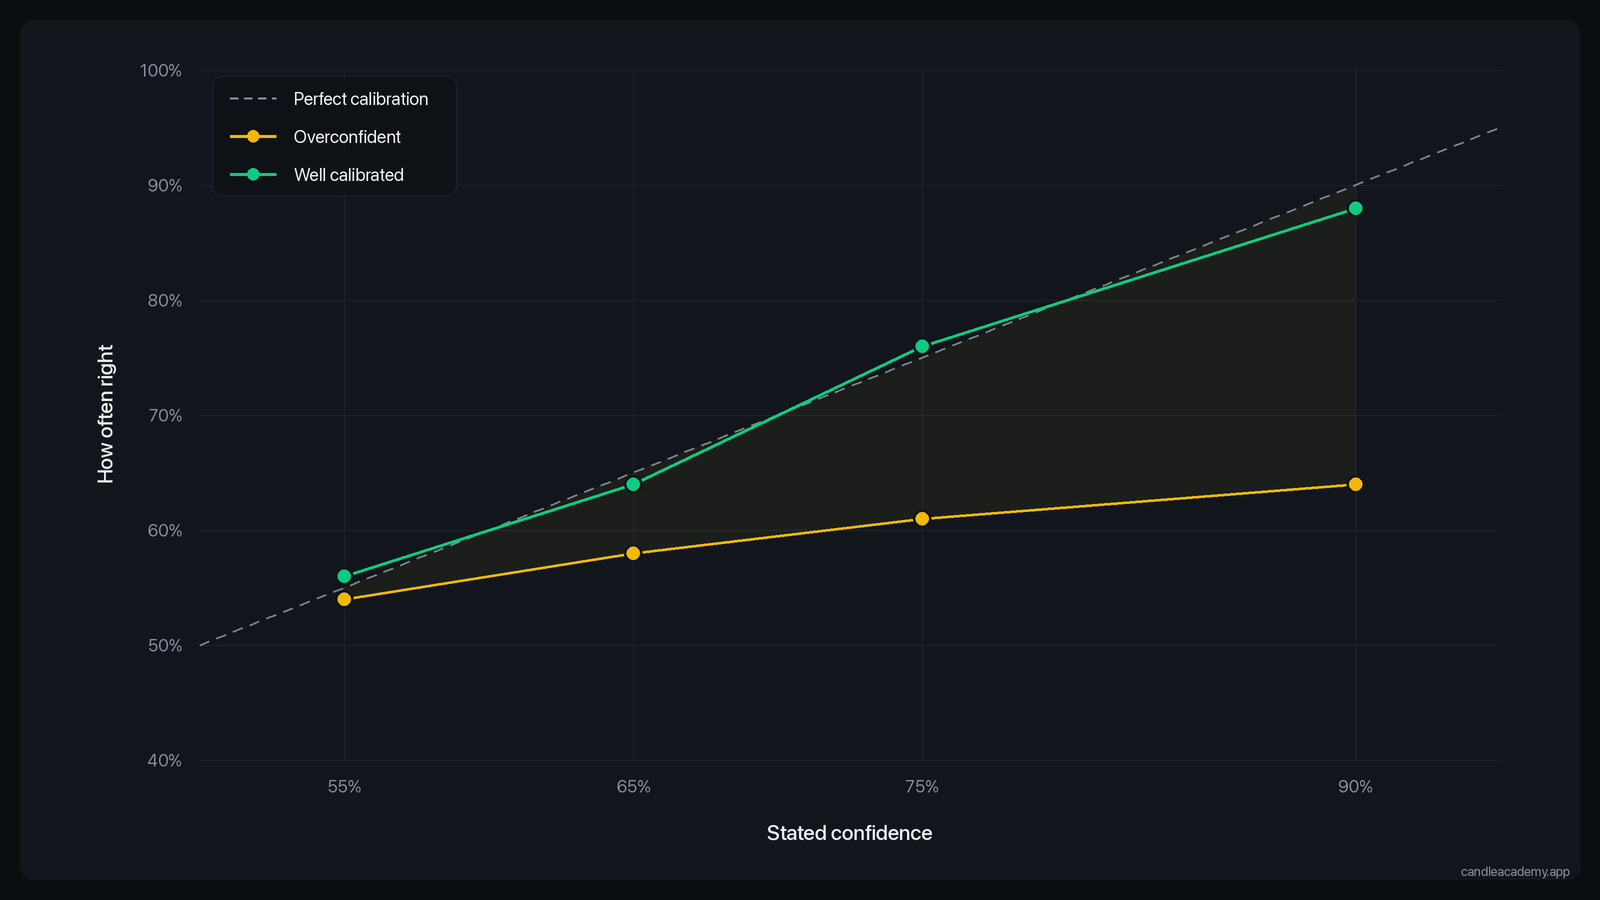 A calibration chart. Points on the diagonal mean your confidence matches reality. Points below it mean overconfidence.
How the game scores you: the Brier score
Candle Academy's prediction level asks for a direction and a confidence: 55%, 65%, 75% or 90%. Points come from the Brier score, a standard way to grade probability forecasts:
- At 55% confidence you play for roughly ±5 points: small win, small loss.
- At 90% confidence you win 24 points when right but lose 56 when wrong.
The asymmetry is the point. If you are only right 60% of the time, claiming 90% costs you more than it earns. The score rewards honest confidence, not bravado. Over time it pushes you toward saying "I don't really know" when you don't really know, which is exactly the habit that keeps traders solvent.
How to test any trading claim
The same logic applies far beyond the game. Whenever you see a strategy, signal group or indicator with an impressive win rate, ask:
- How many trades? Twenty trades say almost nothing.
- Compared with what? Did it beat simply holding, or always going long?
- Out of sample? Was it tested on data it was not designed on?
- After fees? Small edges disappear quickly once fees and slippage are included.
- Win rate or expectancy? A 70% win rate with small wins and large losses can still lose money.
Candle Academy's strategy lab runs exactly these checks on real Binance data. It is a sobering place to test ideas you were sure about.
Try it yourself
The prediction level shows you a real chart cut at a random moment in Binance history. You choose up or down for the next N candles and how confident you are. Then the chart reveals what happened, and your statistics page keeps score: accuracy, confidence interval and calibration.
Play 50 rounds before you decide how good you are. Then play 50 more.
Practise on real charts: Price Prediction Game: Will It Go Up or Down? →
Key takeaways
- The baseline is a coin flip, adjusted for long-term drift.
- Small samples cannot separate skill from luck; you need dozens to hundreds of calls.
- Calibration tells you whether your confidence is honest.
- The Brier score rewards honest probabilities and punishes overconfidence.
- Apply the same questions to every trading claim you see.