Do candlestick patterns work? We tested 12 patterns on 6 years of crypto data
Hammer, engulfing, doji, morning star and more, measured on BTC, ETH, SOL and BNB from 2020 to 2026. Most patterns are within noise of a coin flip. Context is what matters.
Every trading course teaches candlestick patterns. The hammer signals a bottom, the bearish engulfing a top, the doji indecision. The drawings are convincing and the stories make sense. What courses rarely show is a simple count: how often does price actually move the way the pattern says?
So we counted. We scanned four large crypto pairs on three timeframes over almost seven years, found every occurrence of 12 well-known patterns and checked what happened next. The short answer: on their own, almost none of them beat the market's normal behaviour by more than chance. With the right context, a few of them do a little better. None of them is a strategy.
How we tested
- Data: Binance spot candles for BTC/USDT, ETH/USDT, SOL/USDT and BNB/USDT, on 1h, 4h and daily charts, from January 2020 to September 2026.
- Patterns: the nine patterns used in Candle Academy (doji, hammer, shooting star/inverted hammer, marubozu, bullish and bearish engulfing, inside bar, morning star, evening star), detected with exactly the same rules as the game. We added three textbook patterns: harami, three white soldiers/three black crows and the classic shooting star after an uptrend.
- Question: five candles after the pattern, did price close higher (for bullish patterns) or lower (for bearish ones)?
- Baseline: how often price closes higher or lower five candles later at any random moment on the same pair and timeframe. Because crypto rose over this period, "up" happens about 51% of the time and "down" about 48.5%. A pattern only has value if it beats that.
- Honesty checks: 95% confidence intervals, a test that accounts for overlapping windows and coins moving together, and a correction for testing many patterns at once.
That gave us more than 100,000 pattern occurrences.
The results
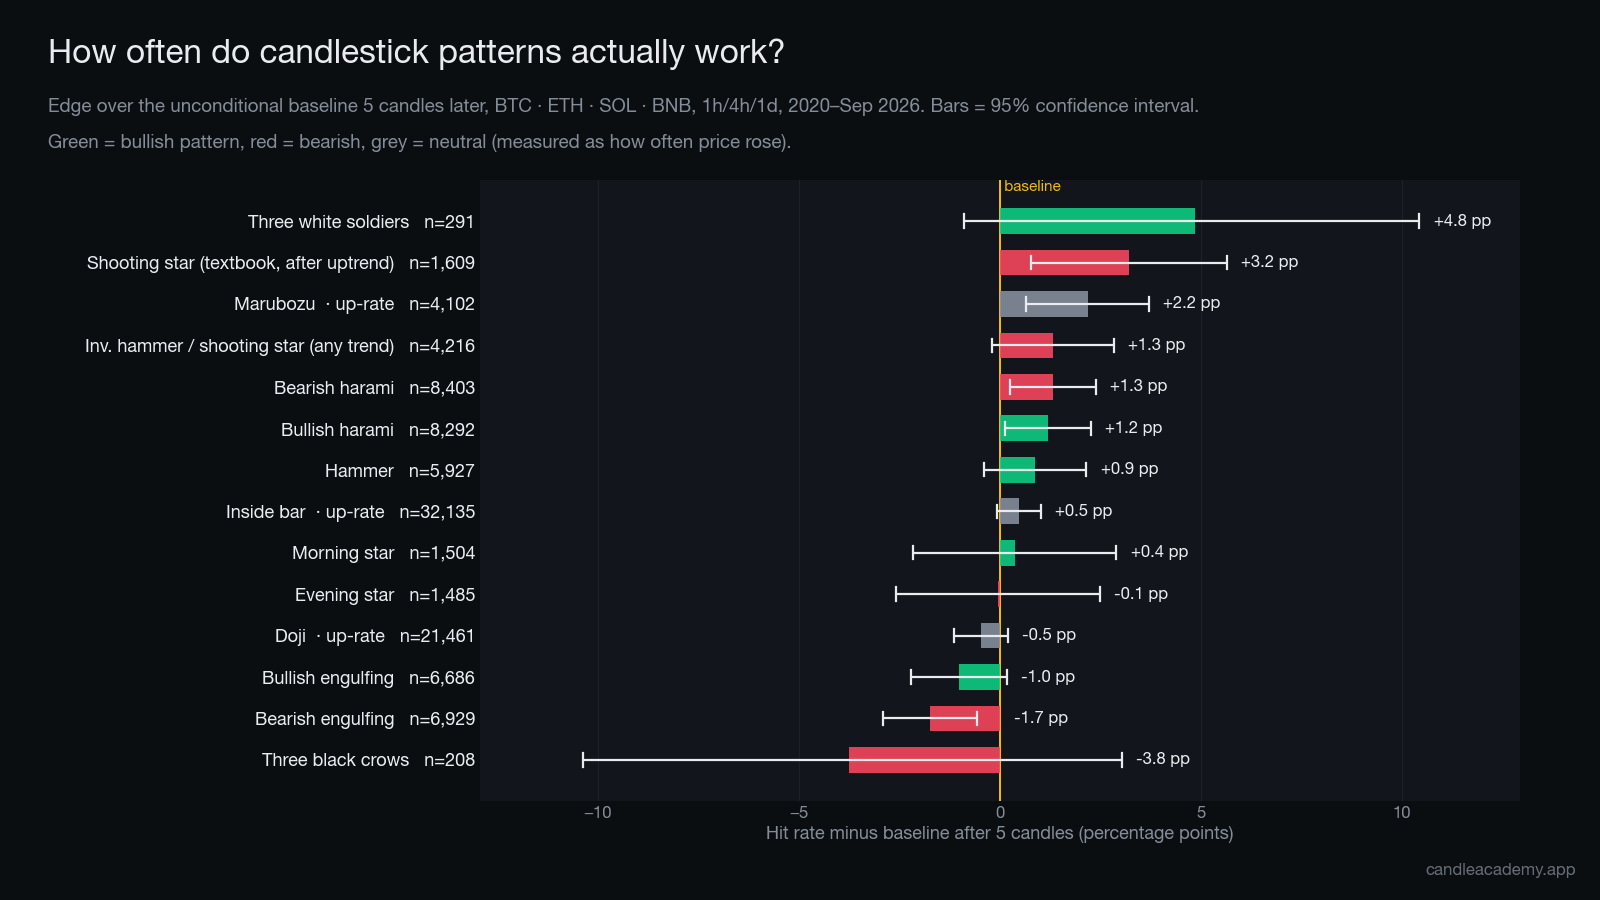 Hit rate minus baseline, five candles after the pattern. A bar that crosses zero means the pattern is indistinguishable from a random moment.
| Pattern | Occurrences | Right after 5 candles | Baseline | Difference |
|---|---|---|---|---|
| Hammer | 5,927 | 52.0% | 51.2% | +0.9 pp |
| Bullish engulfing | 6,686 | 50.1% | 51.1% | −1.0 pp |
| Bearish engulfing | 6,929 | 46.8% | 48.5% | −1.7 pp |
| Morning star | 1,504 | 51.5% | 51.1% | +0.4 pp |
| Evening star | 1,485 | 48.5% | 48.5% | −0.1 pp |
| Shooting star (after uptrend) | 1,609 | 51.8% | 48.6% | +3.2 pp |
| Bullish harami | 8,292 | 52.3% | 51.1% | +1.2 pp |
| Bearish harami | 8,403 | 49.9% | 48.6% | +1.3 pp |
| Three white soldiers | 291 | 56.0% | 51.2% | +4.8 pp |
| Three black crows | 208 | 44.7% | 48.5% | −3.8 pp |
pp = percentage points. For doji, inside bar and marubozu, which are neutral patterns, see below.
What stands out:
- Most patterns sit within one or two points of the baseline. A hammer is right 52% of the time; a random moment is right 51%. Over thousands of cases, that difference is indistinguishable from luck.
- The engulfing patterns did slightly worse than random. Bullish engulfing was below the baseline on every timeframe and every coin. Bearish engulfing too.
- The biggest numbers come from the smallest samples. Three white soldiers at +4.8 pp looks exciting until you notice that it came entirely from SOL and BNB, and was negative on BTC and ETH.
- None of the 12 patterns passes a strict test once you account for testing many patterns at the same time.
Context matters more than the shape
Textbooks say a reversal pattern only means something after a trend to reverse. A hammer in the middle of a sideways market is just a candle with a long wick. So we split every reversal pattern into two groups: after the opposite trend ("with context") and everywhere else. Each group was compared with a baseline that had the same prior trend, so ordinary bounces after a fall are not credited to the pattern.
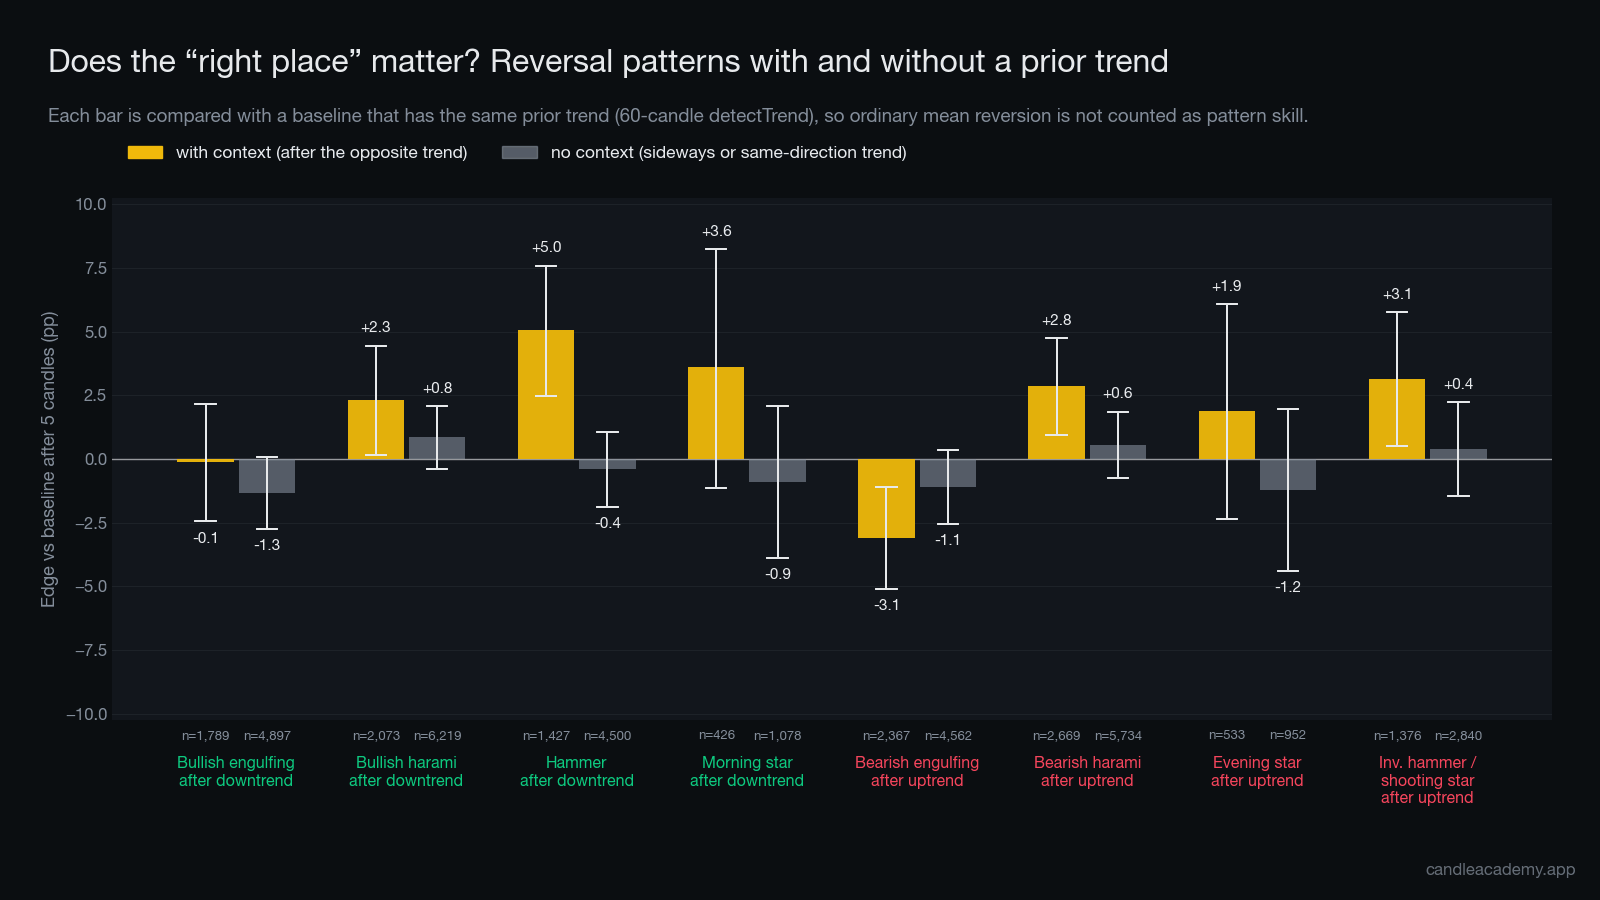 Yellow: the pattern appeared after the opposite trend. Grey: anywhere else.
- For 7 of the 8 classic reversal patterns, the version with context did better than the version without.
- Without context, every one of them was within about ±1.3 points of random.
- The hammer after a downtrend was the one result that survived every check: +5.0 points over the baseline (about 1,400 cases), on BTC, ETH and BNB alike.
- The exception was the bearish engulfing after an uptrend, which did worse (−3.1 points). In this data, a big red candle swallowing the previous green one in an uptrend was more often followed by a bounce than by a drop.
So the old advice is right: where a pattern appears matters more than the pattern itself.
Doji, inside bar and marubozu: no direction, not much else
These three are usually described as "indecision" or "momentum" signals rather than direction calls. We checked both the direction and whether they predict bigger or smaller moves.
- Doji: no directional edge, and no extra volatility compared with candles of similar size.
- Inside bar: often described as a coil before a breakout. In the data, the next five candles moved slightly less than after comparable candles. The compression tended to continue.
- Marubozu (a big candle with almost no wicks): the follow-through that books promise did not show up. After a big red marubozu, price bounced more often than normal.
The surprise: one candle later, price tends to pull back
The most consistent effect in the whole study was not a pattern at all. After a big-bodied candle (a marubozu, an engulfing candle, a hammer), the very next candle went the other way more often than usual, by 2 to 7 points depending on the pattern. If you buy the close of a big green candle because it looks strong, the next candle is slightly more likely to be red.
Why hit rate is still not profit
Even the best result, the hammer after a downtrend, was worth about 0.1% more than a random entry over the next five candles. A spot trade on Binance costs roughly 0.15–0.2% in fees for the round trip. In other words, the strongest pattern edge we found is smaller than the cost of trading it.
Several patterns that were right slightly more often actually did worse on average return. Being right more often with smaller wins is not an edge.
So should you ignore candlestick patterns?
No, but use them for what they are:
- A language for describing price. "Long lower wick at support" is a precise description of buyers stepping in. That is useful when you combine it with levels and trend.
- A reason to look closer, not a reason to trade. A hammer at a daily support in an uptrend is worth attention. A hammer in the middle of nowhere is not.
- Something to test, not to believe. Any claim about a pattern can be counted. Most of them have never been.
Practise reading patterns, honestly
In Candle Academy's level 3 you get real Binance charts and identify the pattern on the marked candle. After each round the game shows what actually happened next, so you see the hits and the misses, not just the textbook examples. The statistics page tracks your accuracy per pattern. The strategy lab lets you run your own tests like the one above.
Practise on real charts: Candlestick Patterns: Doji, Hammer, Engulfing & More →
Key takeaways
- On their own, the 12 patterns we tested were within noise of a random moment.
- Context matters: reversal patterns after the opposite trend did better, and the hammer after a downtrend was the one robust result.
- Engulfing patterns were slightly worse than random on this data.
- The best edge we found was smaller than trading fees.
- Use patterns to read the market, together with trend and levels, not as standalone signals.
Method note: patterns detected with Candle Academy's own rules; outcome measured close to close, five candles after the pattern's last candle. Baselines are matched by pair and timeframe. Results describe 2020–2026 crypto markets and may not hold elsewhere.