Multi-timeframe analysis: the top-down method explained
How to combine daily, 4h and 1h charts so the higher timeframe sets the direction and the lower one the timing, with a simple checklist and real examples.
Have you ever found a perfect setup on the 15-minute chart, entered, and watched it fail for no visible reason? Very often the reason was visible. It was just on a different timeframe.
Multi-timeframe analysis, also called top-down analysis, means looking at the same market on two or three timeframes before you decide. The higher timeframe tells you the direction and the big levels. The lower timeframe tells you when to act. This guide explains how to do it without drowning in charts.
Why one timeframe is not enough
Every chart is a zoom level. A strong uptrend on the 1h chart can be a small bounce inside a downtrend on the daily chart. Both are true at the same time; they just answer different questions.
- The daily chart shows where the big money is pushing and which levels matter over weeks.
- The 4h chart shows the current swing within that picture.
- The 1h or 15-minute chart shows the details of the next few hours.
When the timeframes agree, setups have the wind at their back. When they disagree, the lower timeframe signal is fighting a stronger current.
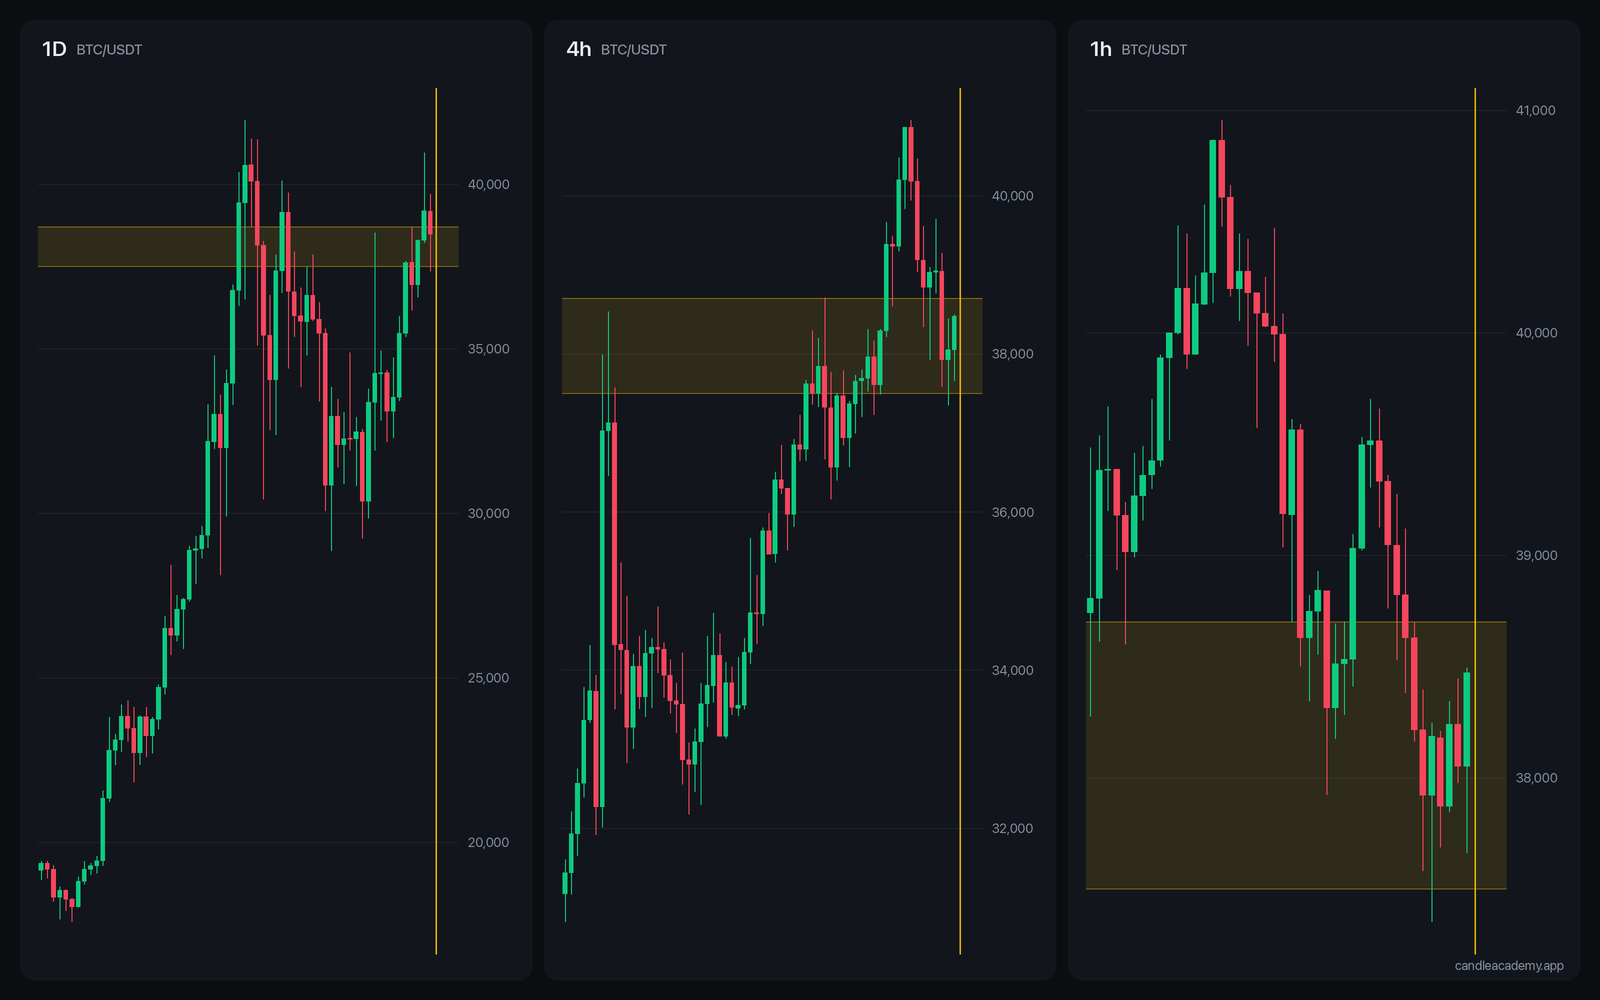 The same moment on three timeframes. The daily trend is up; the 1h chart pulls back into a zone that was resistance on the 4h and daily charts and is now being tested as support.
Choosing your timeframes
A simple rule is to use timeframes about four to six times apart. Common combinations:
| Style | Direction | Setup | Timing |
|---|---|---|---|
| Swing trading | Weekly | Daily | 4h |
| Short-term swing | Daily | 4h | 1h |
| Intraday | 4h | 1h | 15m |
Three timeframes are plenty, and two is often enough. More than that and you will always find one chart that disagrees with your idea, which leads to paralysis or cherry-picking.
The top-down checklist
Work from the top down, and write the answers down if you can:
- Higher timeframe trend: up, down or sideways? Look at the sequence of highs and lows and where price sits relative to a slow moving average.
- Higher timeframe levels: where are the nearest important support and resistance zones above and below price?
- Where is price now? In the middle of a range, or near one of those zones?
- Lower timeframe structure: is the lower chart moving with the higher trend, or against it (a pullback)?
- Trigger: on the lower timeframe, what would tell you the pullback is over? A break of a small level, a strong candle, a higher low.
- Invalidation: where would the idea clearly be wrong? That is where your stop belongs.
The most common high-quality setup in this framework is simple: higher timeframe trend up, price pulls back into a higher timeframe support zone, lower timeframe turns back up. Mirror it for downtrends.
Avoid look-ahead bias
One subtle trap when studying charts: the higher timeframe candle that is still forming. At 10:00 on a Tuesday, the current daily candle is only ten hours old. If you look at historical charts with the finished daily candle, you are using information a trader at 10:00 did not have.
Candle Academy handles this for you. When you switch timeframes in the game, the higher timeframe is shown exactly as it looked at the moment of the decision, including the unfinished candle. That is why answers that look obvious in hindsight are much harder in the game.
Common mistakes
- Hunting for agreement. Flicking through timeframes until one confirms what you already wanted to do is not analysis.
- Ignoring the higher timeframe once in a trade. If the daily chart reaches major resistance, your 15-minute uptrend is about to meet sellers.
- Too many timeframes. Two or three, chosen in advance, are enough.
- Using the lower timeframe for direction. The small chart is for timing. When it disagrees with the big chart, the big chart usually wins.
How to practise
Level 7 in Candle Academy shows you two charts of the same moment: a higher and a lower timeframe. You answer three questions: the higher timeframe trend, what the lower timeframe is doing, and your decision. Three out of three counts as correct. It is the closest thing in the game to a real trading decision, and it builds the habit of looking up before you look down.
Practise on real charts: Multi-Timeframe Analysis (Top-Down) →
Key takeaways
- The higher timeframe sets direction and key levels; the lower one sets timing.
- Use two or three timeframes, four to six times apart, chosen in advance.
- The best setups align: higher trend, higher timeframe level, lower timeframe trigger.
- Beware of finished higher timeframe candles when studying history.
- When timeframes disagree, the higher one usually wins.