RSI explained: overbought, oversold and divergence on real crypto charts
How the Relative Strength Index is calculated, why "overbought" does not mean "sell", how RSI behaves in trends, and how to spot bullish and bearish divergence.
The Relative Strength Index (RSI) is the most popular oscillator in crypto. It shows up in every trading app, every YouTube thumbnail and every "BTC is overbought!" tweet. It is also the indicator beginners misread most often.
This guide explains what RSI measures, why the classic 70/30 rules fail in trends, how to use it in a way that actually adds information, and what divergence is.
What RSI measures
RSI compares the size of recent up-moves with the size of recent down-moves, usually over the last 14 candles:
- For each candle, take the change from the previous close. Gains go in one bucket, losses in the other.
- Average the gains and the losses (with Wilder's smoothing, a kind of moving average).
- Compute RS = average gain ÷ average loss.
- Convert it to a 0–100 scale: RSI = 100 − 100 ÷ (1 + RS).
If the last 14 candles were mostly up, RSI is high. If they were mostly down, RSI is low. Around 50, gains and losses are roughly balanced.
That is all RSI is: a smoothed measure of momentum. It does not know about news, levels, volume or the bigger trend.
Overbought and oversold: the classic rules
The textbook rules are:
- RSI above 70: overbought. Price has risen fast and may pull back.
- RSI below 30: oversold. Price has fallen fast and may bounce.
These rules work reasonably in a sideways market, where price swings between a floor and a ceiling. They fail badly in strong trends.
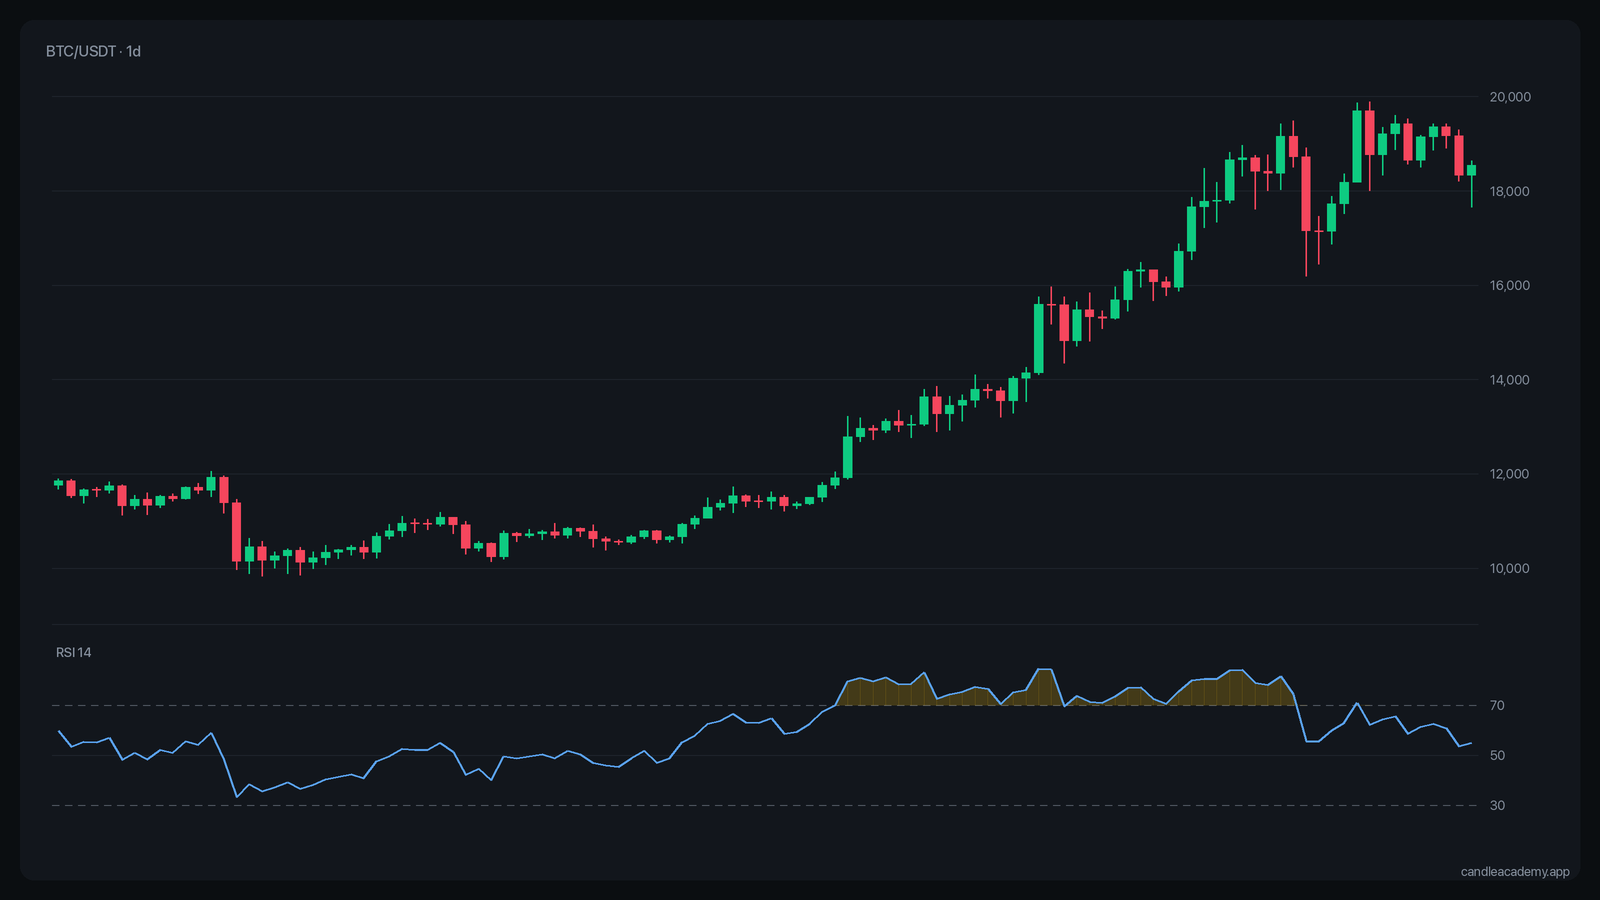 Real BTC/USDT daily data. In a strong uptrend, RSI can stay "overbought" for weeks while price keeps climbing.
In a bull run, RSI can stay above 70 for weeks. Selling every time it crosses 70 means fighting the strongest moves of the year. In a crash, "oversold" can get much more oversold.
A better way to read RSI
Instead of treating 70 and 30 as signals, use RSI to describe the character of the market:
- In uptrends, RSI tends to stay between about 40 and 80. Dips toward 40–50 are often normal pullbacks, not weakness.
- In downtrends, RSI tends to stay between about 20 and 60. Rallies toward 50–60 often fail.
- A shift of range is information. If RSI in a downtrend suddenly starts reaching 70 and holding above 40 on dips, momentum has changed character.
Combine RSI with the trend direction and levels, not instead of them. "RSI is oversold and price is at a daily support and the higher timeframe is still up" is a very different situation from "RSI is below 30".
Divergence: when price and RSI disagree
Divergence is the most interesting RSI signal, and also the most over-hyped.
- Bearish divergence: price makes a higher high, but RSI makes a lower high. The new high was reached with less momentum.
- Bullish divergence: price makes a lower low, but RSI makes a higher low. Selling pressure is fading.
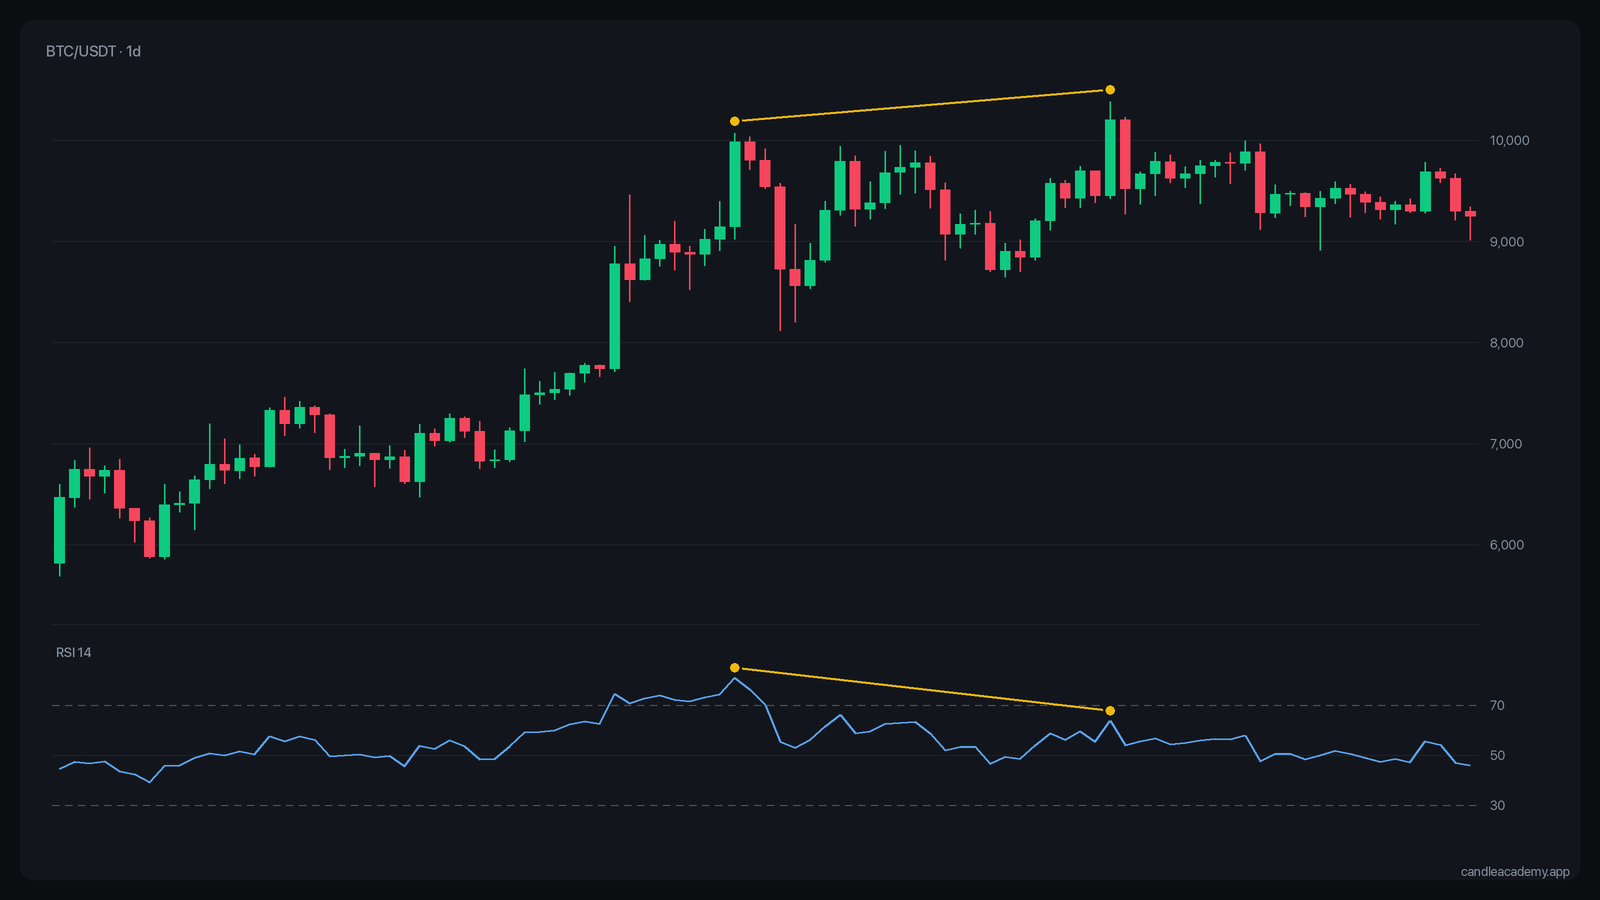 Price makes a new high; RSI does not. That is a bearish divergence.
How to spot it correctly:
- Compare swing points, not random candles. Use clear peaks for bearish divergence and clear troughs for bullish.
- Look at the same two candles on both price and RSI.
- The swing points should be reasonably close together, typically within 5 to 60 candles.
- Wait for confirmation, for example a break of a short-term level, before treating it as a signal.
The honest part: divergence often appears several times in a row while the trend continues. It says momentum is fading, not that the trend is over. In strong trends you will see divergence after divergence until one finally works, and in hindsight only that last one looks obvious.
Common mistakes
- Shorting every 70, buying every 30. In trends this is a reliable way to lose money.
- Changing the period until it "works". RSI(7), RSI(21) and RSI(14) will each look perfect on a different past chart. Pick one and learn how it behaves.
- Using RSI alone. RSI is derived from price. It cannot tell you more than price itself; it just presents it differently.
- Drawing divergence between random points. If you have to search for the two points that make it work, it is not a divergence.
How to practise
Candle Academy has two places to train this. In level 5 you read moving averages, RSI and volume on real charts and see how much they actually told you about what came next. The RSI divergence training mode shows you real pairs of swing points; you decide whether there is a divergence and which way it points.
Practise on real charts: Technical Indicators: Moving Averages, RSI and Volume →
Practise on real charts: RSI divergence →
Key takeaways
- RSI measures momentum: the balance of recent gains and losses.
- 70/30 rules work in ranges and fail in trends.
- Use RSI to describe the market's character and changes in it.
- Divergence means momentum is fading, not that the trend has ended.
- RSI is a lens on price, not an independent signal.