Support and resistance: how to draw levels that actually matter
A step-by-step method for finding support and resistance on crypto charts, why levels are zones and not lines, and how to tell a real breakout from a fakeout.
Support and resistance are probably the most used ideas in technical analysis, and the most abused. Draw enough lines on a chart and price will always be "near a level". The skill is not drawing lines; it is choosing the few levels the market actually cares about.
This guide gives you a simple, repeatable way to find them, explains why they work at all, and covers the classic traps.
What support and resistance are
- Support is a price area where falling price has repeatedly stopped and turned up. Buyers were waiting there.
- Resistance is a price area where rising price has repeatedly stopped and turned down. Sellers were waiting there.
Why would anyone wait at the same price? Because people remember. Traders who bought at a level and saw it work buy again. Traders who missed the last bounce place orders to catch the next one. Traders stuck in a losing position wait for price to come back to their entry so they can exit at break-even. All of that leaves orders sitting around the same prices.
Levels are zones, not lines
Price almost never turns at exactly the same cent twice. On a BTC chart, a level that held three times might have turned at 61,850, 62,100 and 61,700. Drawing one exact line forces you to pick one of those numbers and then argue with the chart when price misses it by 0.3%.
Think in zones instead. A practical width is roughly a quarter to half of the average candle range (ATR) on the timeframe you are using. On a daily chart that zone is wider than on a 1h chart, which is exactly what you want.
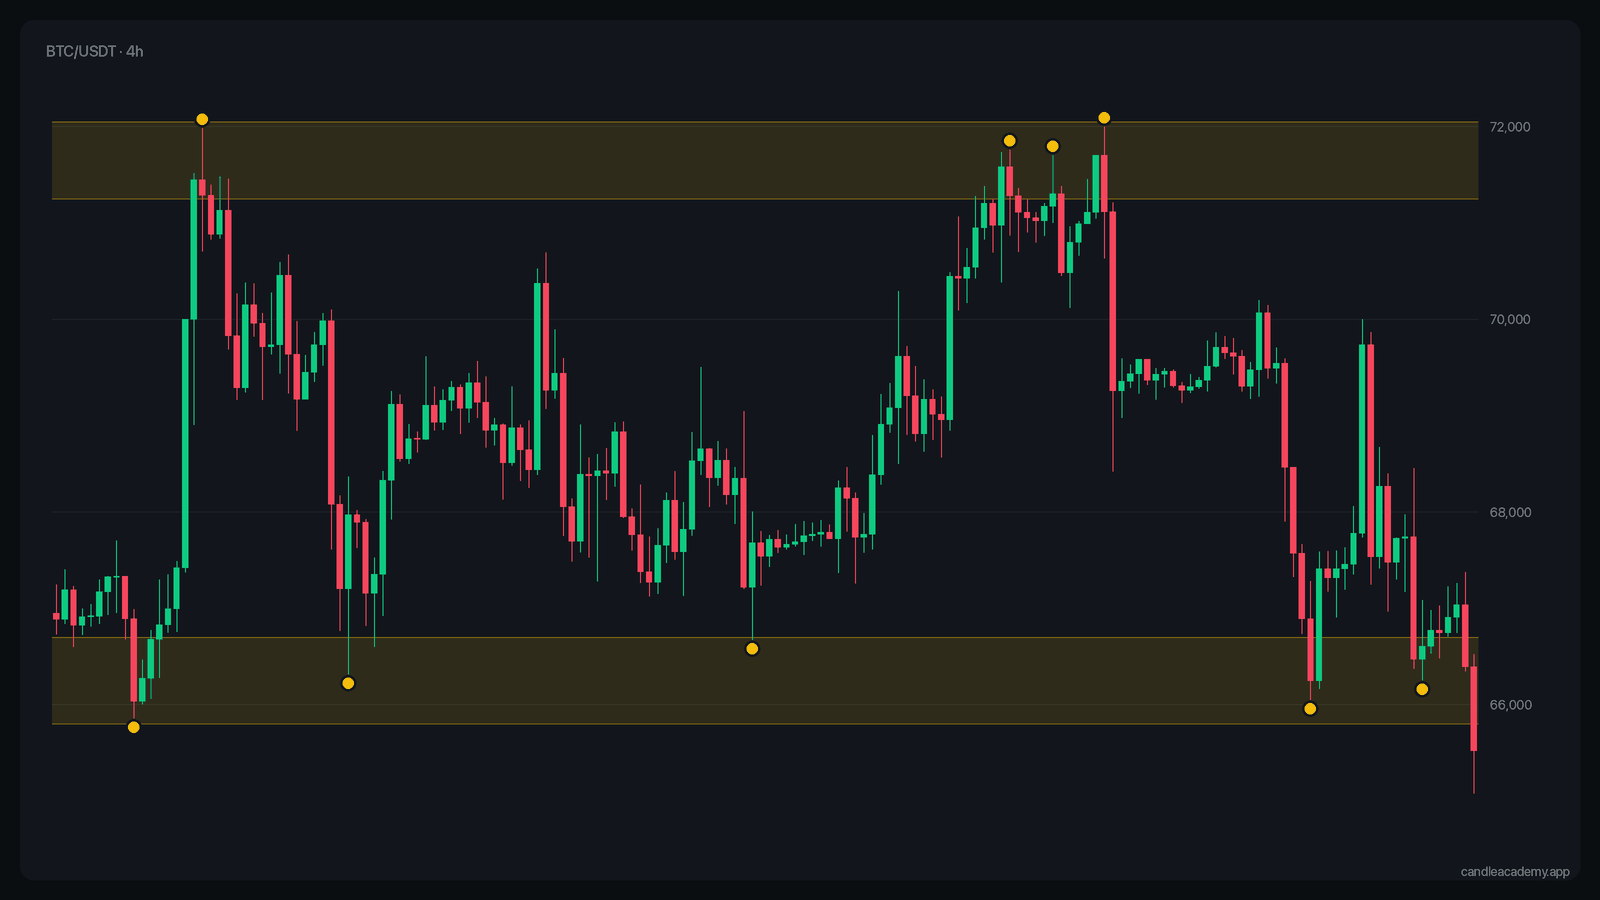 Real BTC/USDT 4h data. Each zone was tested several times before price left it.
A step-by-step method
- Start on a higher timeframe. Open the daily or 4h chart and zoom out to at least a few months of data. Levels visible there matter more than levels you only see on a 5-minute chart.
- Mark obvious swing highs and lows. Look for places where price made a clear turn: a peak with lower highs on both sides, or a trough with higher lows on both sides.
- Look for clusters. A level becomes interesting when two or more turns line up around the same price. One touch is a point; two or three touches make a level.
- Prefer strong reactions. A turn that started a large move counts more than a small wobble.
- Keep only the nearest few. You usually need the closest one or two levels above price and one or two below. Everything else is noise for now.
- Check the lower timeframe. Drop to 1h to see how price behaves as it approaches the zone. That is where you look for confirmation, not where you find levels.
Role reversal: old resistance becomes support
One of the most reliable behaviours in charts is role reversal (also called a flip). When price breaks above resistance and stays there, that old resistance often acts as support on the way back down. The same works in reverse for broken support.
The logic is the same "memory" argument: traders who sold at resistance and watched price break above them are happy to buy back at their original price. Traders who missed the breakout now have a second chance.
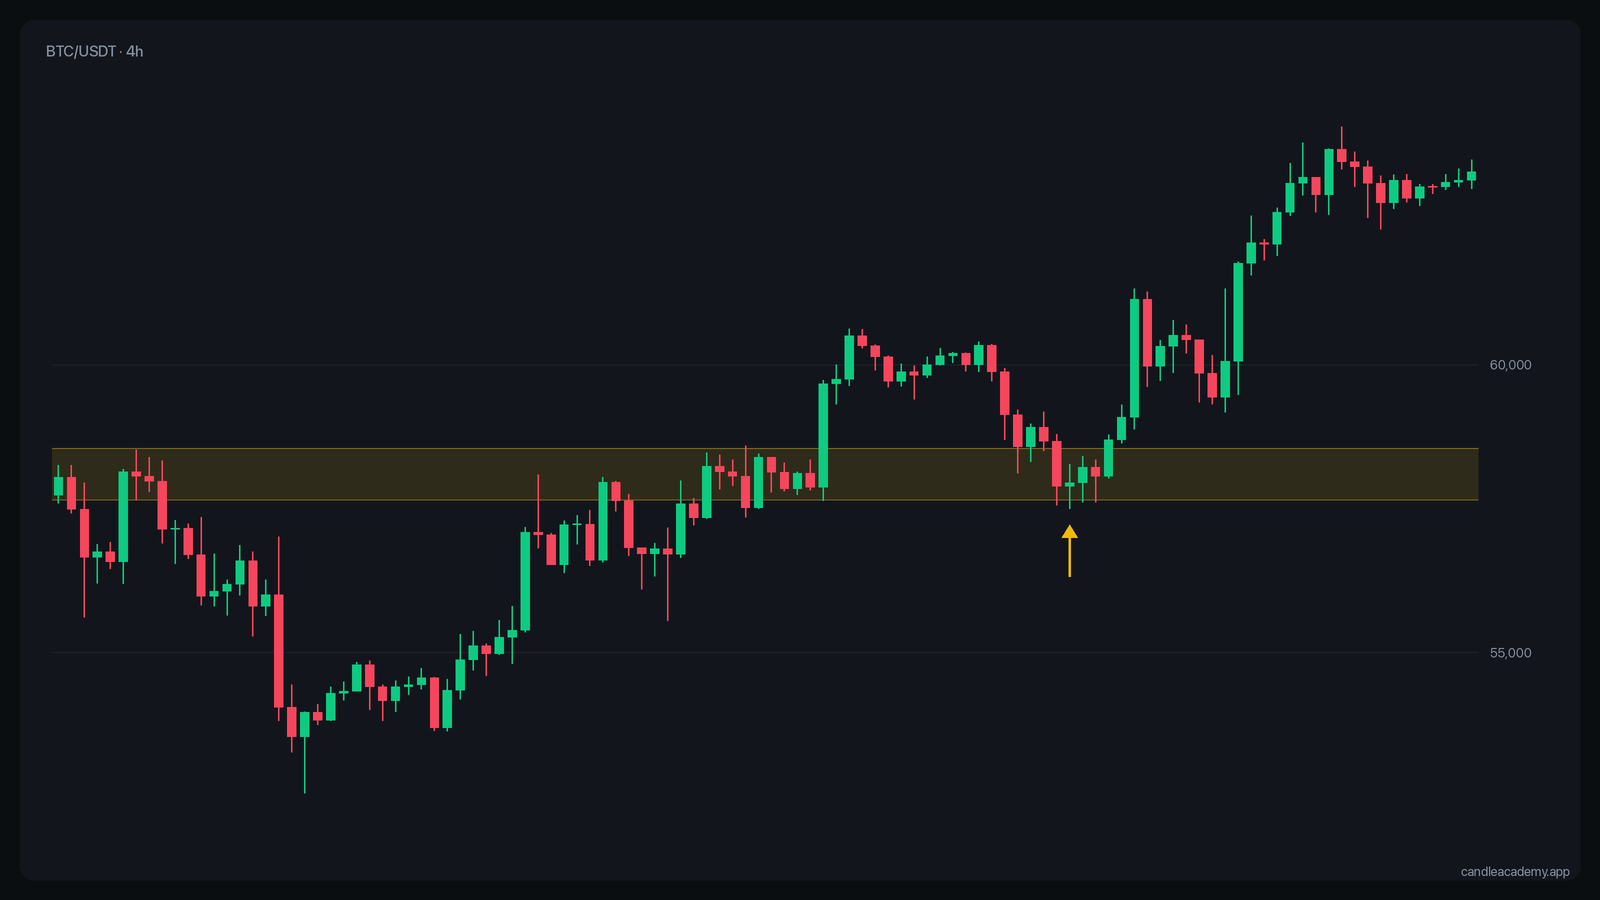 A break, a retest of the old resistance from above, and continuation.
Breakout or fakeout?
Every level eventually breaks. The question is whether the break is real.
A fakeout happens when price pokes through a level, triggers stops and breakout orders, and then quickly returns inside the range. Crypto markets are full of them, especially around round numbers and obvious highs and lows where many stops are clustered.
Signs a breakout is more likely to hold:
- The candle closes beyond the zone, not just wicks through it. A close on the timeframe you trade from matters more than an intraday spike.
- Volume is above average on the breakout candle.
- The higher timeframe agrees. A break in the direction of the daily trend holds more often than a break against it.
- A retest holds. Price returns to the broken level, the level holds from the other side, and price moves on.
None of these are guarantees. They shift the odds, and only a little. Candle Academy has a separate training mode with nothing but real breakouts and fakeouts from Binance history, so you can find out how often you can tell them apart.
Common mistakes
- Too many lines. If your chart has ten levels, price is always next to one, and none of them helps you decide anything.
- Drawing levels after the fact. It is easy to see a perfect level once you know where price turned. Practise drawing levels on the left side of the chart and only then reveal what happened.
- Ignoring the timeframe. A level on the 15-minute chart can be invisible on the daily chart. When the two disagree, the higher timeframe usually wins.
- Expecting exact bounces. Treat a level as an area where something interesting may happen, not as a price that must hold.
How to practise
In level 4 of Candle Academy you get a real chart cut at a random moment and pick the levels you think matter. Then the game shows where price really reacted. Over a few dozen rounds you will notice which kind of levels you overrate, usually the ones with a single touch.
Practise on real charts: Support and Resistance Levels →
Key takeaways
- Support and resistance are areas where orders cluster because traders remember prices.
- Draw zones, not lines, sized to the timeframe's volatility.
- Find levels on higher timeframes; use lower timeframes for timing.
- Broken levels often flip roles.
- Breakouts that close beyond the zone, on volume and with the higher trend, hold more often, but still not always.