How to read candlestick charts: a practical guide for beginners
What open, high, low and close really mean, how to read bodies and wicks, and why one candle tells you less than you think. With real Binance examples.
Open any exchange and the first thing you see is a candlestick chart. It looks technical, but each candle answers four simple questions about a period of time: where did price start, where did it end, how high did it go and how low did it go. Once you can read those four numbers at a glance, every other tool in technical analysis becomes easier.
This guide explains the anatomy of a candle, what bodies and wicks tell you about buyers and sellers, how timeframes change the picture, and the most common beginner mistakes.
The four prices inside every candle
A candle summarises all trades in one period, for example one hour on a 1h chart or one day on a 1D chart. It stores four prices, usually written as OHLC:
- Open: the first traded price of the period.
- High: the highest price reached.
- Low: the lowest price reached.
- Close: the last traded price of the period.
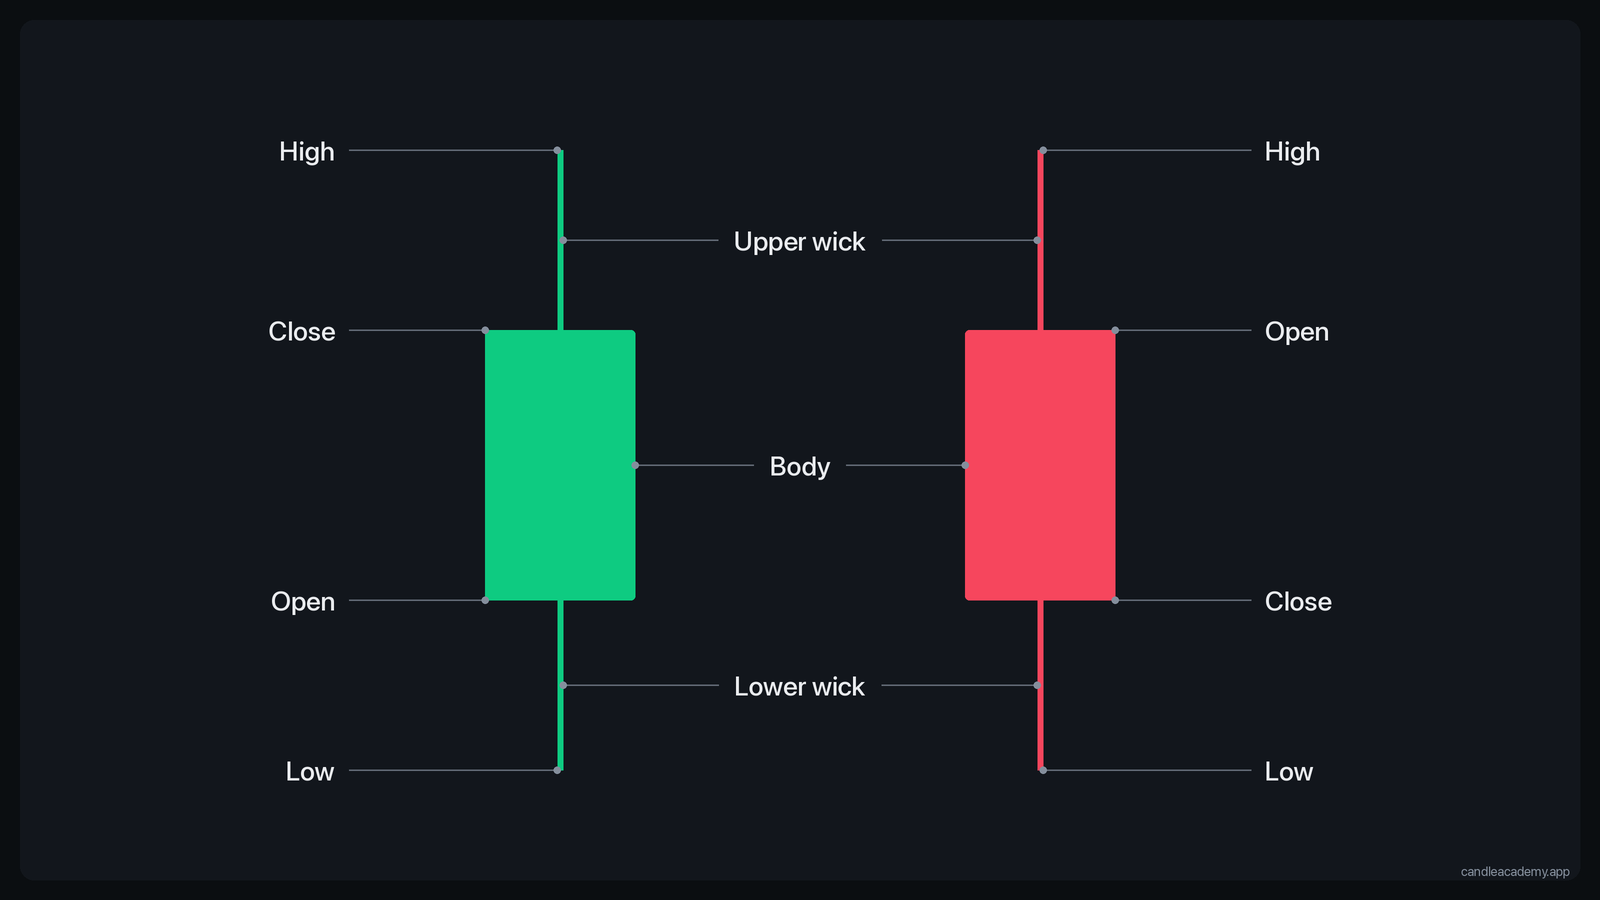 A green candle closed above its open; a red candle closed below it.
The body is the box between open and close. The thin lines above and below it are the wicks (also called shadows). The upper wick reaches the high, the lower wick reaches the low.
Colour tells you the direction. On Binance and most crypto platforms, green means the close is above the open (price rose during the period) and red means the close is below the open. Some platforms use white and black or let you swap the colours, so always check the legend.
Reading the body: who won the period?
The body is the net result of the fight between buyers and sellers.
- A long green body means buyers pushed price up and held it there until the close.
- A long red body means sellers were in control from open to close.
- A small body means the period ended close to where it started. Neither side won clearly.
"Long" and "small" only make sense relative to the candles around it. A 1% move is a huge candle on a quiet Sunday and a tiny one during a market crash. Experienced traders compare a candle with the recent average range, which is what the ATR (average true range) indicator measures.
Reading the wicks: what was rejected
Wicks show prices the market visited but did not accept by the close.
- A long lower wick means sellers pushed price down, but buyers bought it back up. The low was rejected.
- A long upper wick means buyers pushed higher, but sellers sold into the rally. The high was rejected.
- No wicks at all (a "marubozu") means price closed at or near the extreme of the period. One side dominated the whole time.
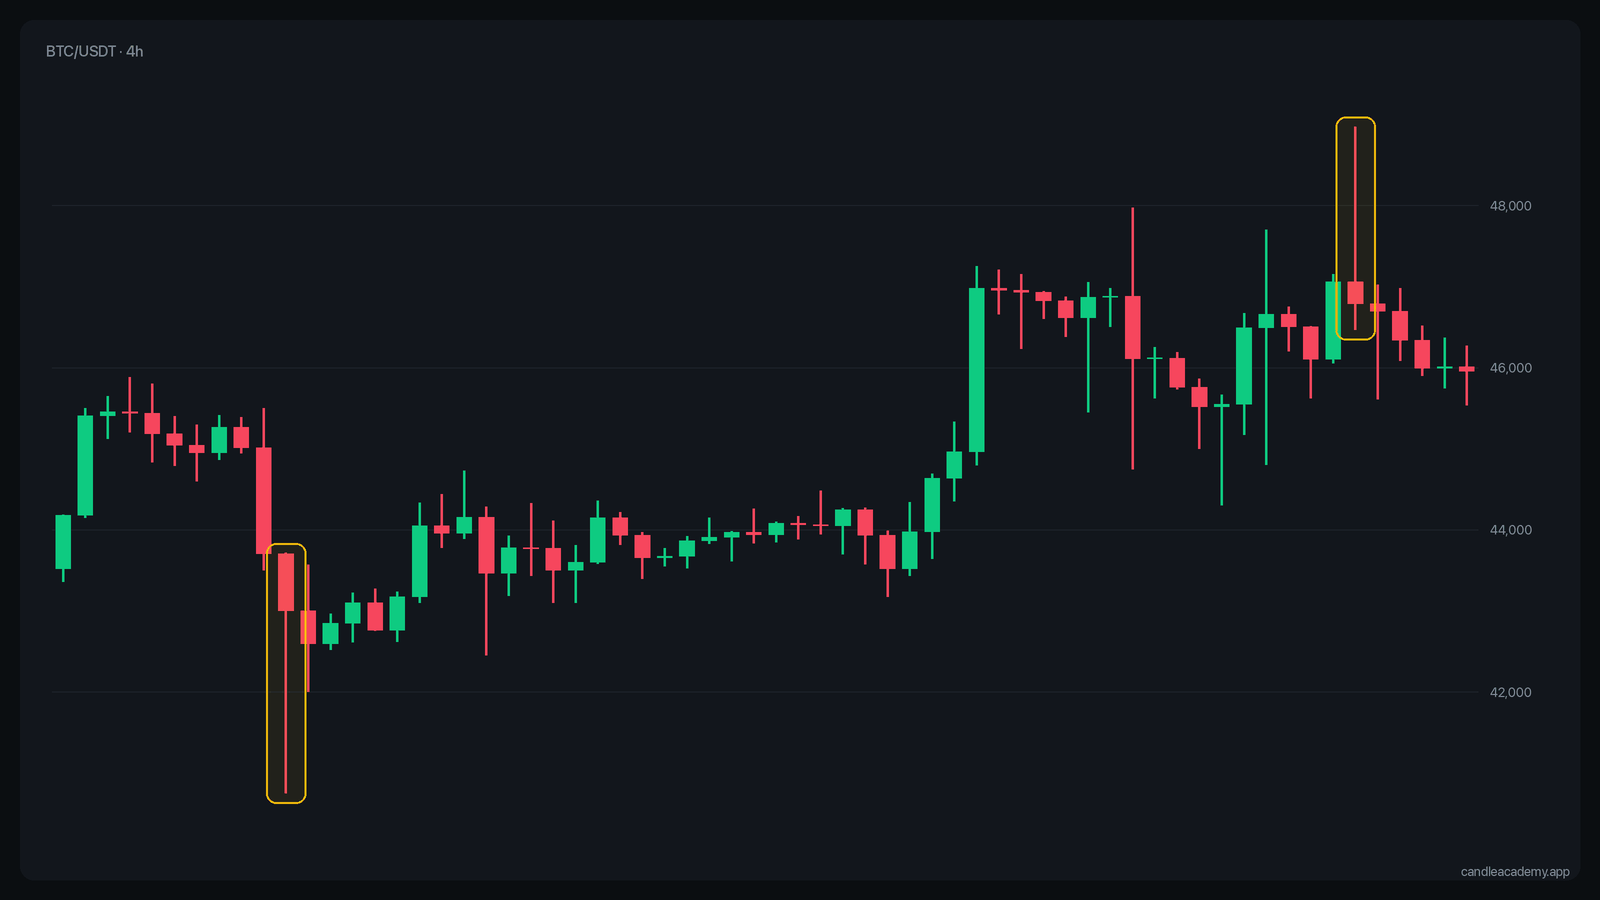 Real BTC/USDT 4h candles. Wicks mark prices the market tried and rejected.
This is the logic behind many candlestick patterns. A hammer, for example, is simply a small body with a long lower wick after a decline: sellers tried, buyers answered. Whether that actually predicts anything is a different question, and we tested it in our article on candlestick patterns.
One candle, many stories
Here is the catch: a candle hides the path price took inside it. A green candle with a long lower wick could mean "price fell first, then rallied", or price could have rallied, dropped and rallied again. You cannot know from the candle alone.
That is why a single candle rarely means much on its own. Context matters more:
- Where is the candle? A long lower wick at a level where price has bounced before is more interesting than the same wick in the middle of nowhere.
- What came before it? A small-bodied candle after a long rally says something different than after a long decline.
- How big is it? Compare it with the last 10 to 20 candles, not with your expectations.
Timeframes: the same market, different candles
The candle is only a container for time. Four 1h candles together make one 4h candle; six 4h candles make one daily candle. The daily candle keeps the open of the first hour and the close of the last one, plus the highest high and lowest low in between.
That has two consequences:
- A pattern on a small timeframe can disappear on a bigger one. A dramatic 5-minute hammer might be a tiny wick on the hourly chart.
- Bigger timeframes carry more weight. A daily candle contains far more trading than a 5-minute candle, so it is less affected by random noise.
Beginners usually start on short timeframes because more seems to happen. In practice it is easier to learn on 4h and daily charts, where candles are calmer and the structure is clearer. We go deeper in multi-timeframe analysis.
Volume: the candle's missing fifth number
Most charts show volume as bars below the candles: how much was traded in each period. Volume helps you judge how serious a move was. A breakout candle with twice the usual volume has more participants behind it than one with below-average volume. A long wick on very low volume might just be a thin market.
Common beginner mistakes
- Reading the live candle as if it were finished. Until the period closes, the candle can change completely. A "hammer" five minutes before the close can end as a plain red candle.
- Forgetting the timeframe. Always check which timeframe you are looking at before you draw conclusions.
- Treating colour as a signal. Three green candles in a row do not make the next one more likely to be green. Markets do not owe you a pattern.
- Ignoring scale. On a log scale, equal percentage moves look equal; on a linear scale, the same 10% move looks much bigger at higher prices. Over long periods, the log scale gives a fairer picture.
How to practise
Reading candles is a visual skill, like reading handwriting. Theory gets you started, but you get fluent by looking at hundreds of real candles and checking yourself.
In Candle Academy's first level you get a real Binance chart from a random moment in the past and questions about the marked candle: where it opened and closed, which wick is longer, who won the period. After each answer you see the explanation. A few rounds a day are enough to make OHLC automatic.
Practise on real charts: Candlestick Anatomy: Open, High, Low, Close →
Key takeaways
- Every candle holds four prices: open, high, low and close.
- The body shows who won the period; the wicks show what was rejected.
- Size only makes sense compared with nearby candles.
- One candle says little without context: location, what came before, and volume.
- Higher timeframes are calmer and better for learning.